Heatmap Interpretation Mistakes DTC Operators Make
Heatmaps mislead without proper sample sizes and device segmentation.
Heatmap interpretation mistakes cost DTC operators conversions when visual patterns become redesign instructions without enough evidence. The tool is not the central problem. Sound decisions need enough samples, device and traffic-source segmentation, and checks against conversion outcomes. Even with those checks, heatmaps cannot show what every shopper wants or track agents that choose products without visiting the page.
Why heatmaps fail DTC operators before anyone reads a single color
A heatmap highlights an element, the team confidently gives it more prominence, and conversion gets worse. The decision looked grounded in observed behavior. Yet the overlay established only that visitors interacted with something. The failure began before anyone interpreted the colors, when the operator opened the tool without a question about what was blocking conversion.
Glued’s audit methodology across 350+ DTC projects identifies prioritization, rather than data collection, as the bottleneck. Brands have heatmaps on the wrong pages and collect data they have no plan to use. Page selection is already an optimization decision. When quantitative analytics have not established where traffic and conversion diverge, visual intensity becomes a substitute for commercial relevance. Stakeholders can then read the same gradient as support for different existing opinions.
DeepSync’s 2026 analysis identifies structural reasons this happens. Aggregation hides differences between segments, while a snapshot of an atypical traffic period can resemble a stable pattern. The polished overlay also discourages scrutiny of sample counts and filters. These are failures in the relationship between the operator and the evidence.
What each heatmap type actually measures and where its signal ends
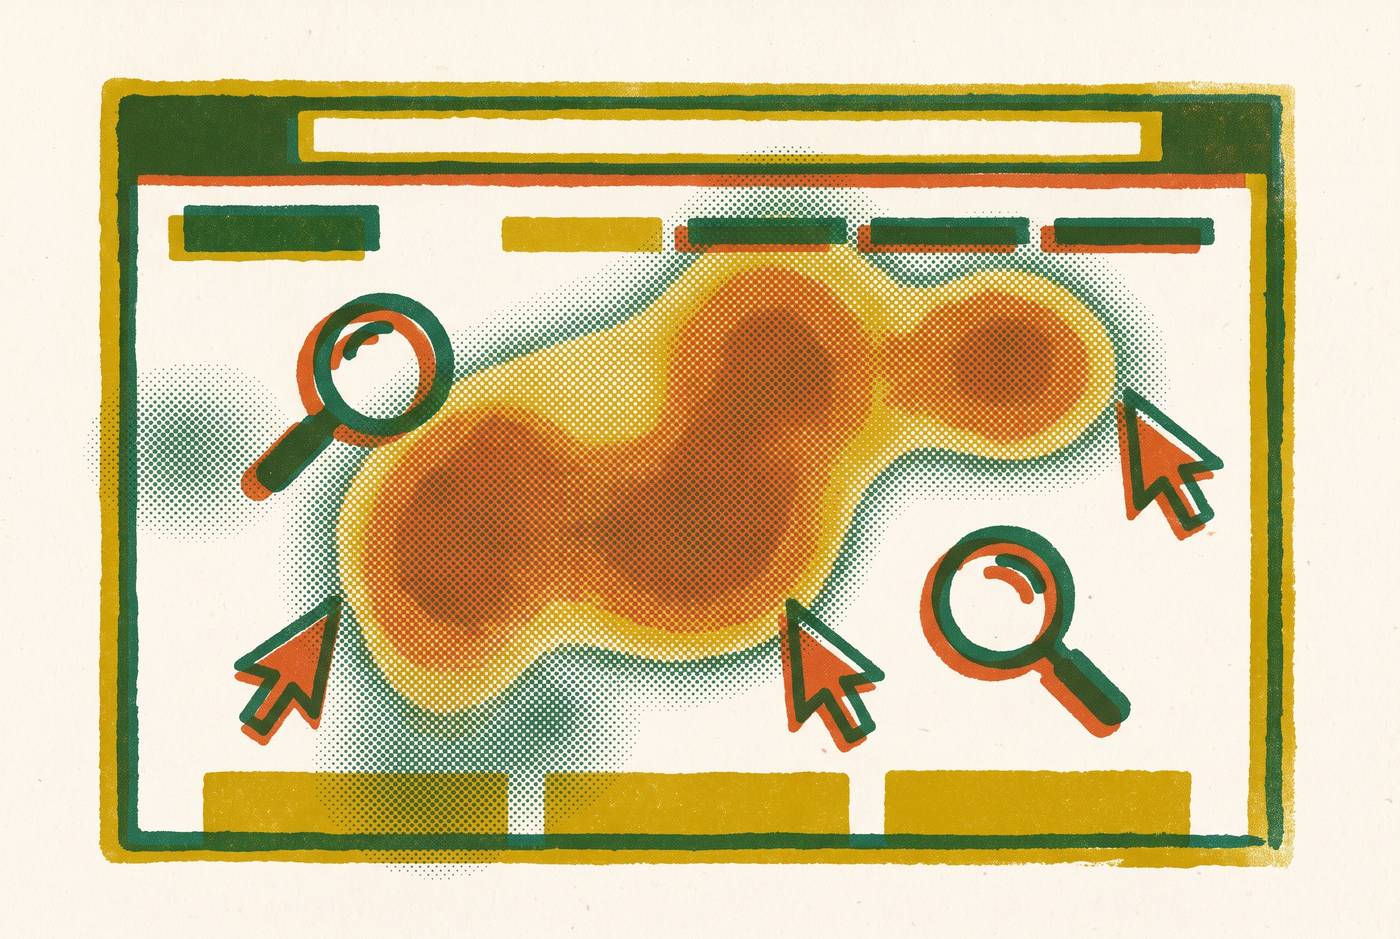
Click maps show taps and clicks, including those on non-interactive elements. They can expose CTA placement problems, broken links, and false affordances. An image with no link can still get a lot of clicks. That cluster indicates an expectation that the image would respond, but the map alone does not establish what response the visitor wanted.
Scroll maps show how far visitors go down a page before they leave. They establish whether people reach conversion-critical content. Move maps answer a different, narrower question. They track desktop cursor position as a proxy for visual attention, but cursor position and eye gaze do not perfectly align. Some people move the cursor randomly while reading, so meaningful patterns require many sessions.
On mobile, click and scroll maps are still useful, while move maps have no useful cursor signal. Attention maps bring click, scroll, and movement data together in one view. That combination inherits each input’s limitations. Across all types, the boundary is the same. They locate interaction and attention without establishing what change would help, leaving characteristic mistakes around sample stability, device differences, reach, and intent.
How thin sample sizes turn random noise into confident redesigns
A hot zone built from a handful of sessions can look as persuasive as one supported by a substantial sample. The color does not communicate statistical stability. A few visitors who click in the same area may seem to form a pattern that fades as more traffic comes in. Segmentation and careful reading cannot make up for too few sessions.
Establish a page-specific minimum session threshold before reviewing a heatmap for decisions, taking traffic volume into account. DeepSync recommends documenting session count on every internally shared screenshot. Timing needs the same scrutiny as volume. Promotional traffic brings a different audience from steady-state traffic, so a CTA that looks cooler may be due to a change in who visits. Comparing like periods or using controlled tests avoids treating seasonal differences as evidence for a redesign.
Why aggregate heatmaps mislead when desktop and mobile traffic share the same overlay
An overlay that blends desktop and mobile behavior can describe neither population accurately because the layouts and interaction methods differ. Fold lines shift, CTAs sit in different places in the visual hierarchy, and people use touch in place of the cursor. These differences change what users can reach and how they interact.
A CTA can appear hot because desktop visitors use it while mobile visitors cannot readily see or access it, a limitation the aggregate hides entirely. A change based on that blend may help one device population while harming the other. Scroll maps have the same weakness because mobile visitors may reach less of the page, creating different content-prioritization needs that disappear in the combined view.
The procedural correction is mandatory device segmentation before any recommendation. DeepSync calls for reviewing mobile and desktop side by side. Device filtering, a prerequisite for recommendations, also prevents desktop cursor behavior from being mistaken for evidence about mobile attention, where move maps supply no useful signal. An element must be judged by whether it attracts interaction within the layout each population actually encounters.
How misreading scroll depth produces the wrong fix for the right observation
Low scroll depth establishes that visitors did not reach much of the page, while leaving open whether the page failed. Visitors may have found the answer above the fold and converted, or they may have been confused and left. Those explanations call for opposite decisions, yet both can leave the same lower section cold.
The familiar inference is that the page is too long, so content should move higher or disappear. That can remove information that buyers need when they take longer to decide. On product detail pages, trust signals, sizing guides, return policies, and ingredient lists may contribute to purchase even when relatively few visitors reach them. Their position becomes a conversion problem when evidence connects their visibility to buying.
Glued’s DTC audit data yields a positional finding: add-to-cart events correlate strongly with information placement above a midpoint scroll depth threshold on product detail pages. It does not support indiscriminately cutting everything below that point. The relevant context includes the page’s conversion rate, the traffic source, and the visitor’s intent on arrival.
The corrective workflow begins with the cold zone, then checks page conversion and session replay for visitors who did not scroll before forming a hypothesis. DeepSync likewise calls for cross-referencing cold zones with conversion metrics and replay. This prevents an observation about reach from becoming an unsupported conclusion about content. It also redirects attention toward click signals that may reveal why visitors stopped progressing.
Dead clicks and rage clicks as the signals most operators skip past
Dead clicks show that someone tried to use something that does not respond. A visitor clicking a product image may expect zoom, while a click on a headline may indicate an expected link. These are false affordances. Glued identifies dense clicks on non-linked images as a distinct diagnostic signal because the interface has invited an action it does not provide. Replay can help show what the visitor expected to happen.
Rage clicks show that someone tried to use the same element over and over. They signal frustration. On a product image, they typically indicate a missing zoom or gallery feature, while on a checkout button they can indicate a payment error or slow load. DeepSync recommends reviewing both dead-click and rage-click reports with standard overlays, then examining replay for flagged clusters. The repeated action locates the problem without conclusively identifying its cause.
A lot of clicks on navigation calls for the same care when bounce is also high. Visitors may be hunting for content they cannot find. The consequence is a different order of priorities. Fixing a false affordance removes friction for the visitors who ran into it, while moving a CTA that already gets clicks may bring no measurable gain.
Treating a hot zone as purchase intent when it may be navigation confusion
Click density reflects both an element’s visual prominence and the expectations visitors bring to it. It does not establish that those expectations were met. An element can attract attention precisely because it appears to offer a route that visitors need, then disrupt the purchase path when its destination proves unrelated. Enlarging it amplifies the mismatch.
Glued’s promotional banner example makes that distinction concrete. A banner was the hottest click zone on a DTC storefront, so merchandising doubled its size. Session replay revealed that visitors expected category navigation but reached an unrelated promotion and bounced. The appropriate correction was clearer navigation labels and a smaller banner.
The diagnostic step is to pair click density with the next-page funnel and conversion for sessions that included that click. A cold CTA that converts well is more valuable than a hot element that sends visitors away. This is the gap between observing behavior and explaining it. Even when replay and funnel data identify the problem correctly, the proposed solution still needs validation.
Implementing changes from heatmap observations without a validation step
A heatmap generates a hypothesis. Its visual persuasiveness can nevertheless build stakeholder consensus faster than the evidence justifies. A cold zone around a CTA gives teams an immediate reason to move it, even when they do not know why so few visitors use it. Pressure to act then turns an incomplete diagnosis into a live conversion risk.
A redesigned page can appear to correct the overlay while converting worse than the original. Session replay provides the bridge from the pattern to a testable explanation by showing the behavior behind it.
The organizational rule is no implementation without a recorded hypothesis and measurement plan. The team needs to decide in advance how it will judge whether the change worked. This does not mean every change requires an A/B test. When traffic limits statistical testing, replay and qualitative confirmation can reduce the risk of acting on a mistaken explanation, although they do not make observation equivalent to validation.
Heatmaps depend on observable page interaction, while some high-value shopping journeys include product-selection decisions that produce no human clicks at all.
What heatmaps cannot show about AI-referred shoppers and agents that never visit the page
AI-referred shoppers may land straight on product detail pages after doing their research elsewhere. Their on-page behavior cannot be interpreted as though the visit began with an open-ended search. Limited exploration can reflect pre-qualified intent rather than disengagement, even when these shoppers have longer sessions and more page interactions. Without traffic-source segmentation, an operator may respond by adding content or trying to extend engagement on sessions that already convert well.
Many read structured product data from feeds and on-page markup, making selection decisions without generating clicks, scrolls, or cursor movements. Some newer computer-use agents navigate pages directly and produce session data, but that exception does not make heatmaps a complete account of AI-mediated shopping.
AI-powered on-site chat offers a different diagnostic input because conversations expose what shoppers were trying to accomplish. They provide intent data by revealing questions that blocked purchase and product attributes that helped or prevented conversion. Brands that use those questions to update product content and FAQ language have a merchandising feedback loop that click maps alone cannot give them.
Bots also complicate the sessions that heatmaps do record. AI crawlers and headless browser bots account for a share of storefront sessions in 2026, and most heatmap tools lack meaningful upstream filtering, though some offer partial bot flagging or IP-level filtering. A checkout rage-click cluster may come from a frustrated customer or a bot struggling with a script-rendered form. There is no clear industry-standard fix for that distinction.