
Micro-Conversion Tracking for DTC Stores Without Enough Purchase Data
Tracking smaller customer actions reveals where your funnel breaks before purchase data arrives.
Purchase conversion rate is the number every DTC operator checks first, and it's the number least able to tell them what to do next. Pooled GA4 data across 19 DTC stores puts the median purchase conversion rate at 1.17%, a frequency too low to build a decision on, so the typical brand converts roughly one session in a hundred into an order. A store running a modest level of monthly traffic needs weeks, often months, of data before a change to a product page, a checkout flow, or an ad campaign produces a detectable shift in purchase events, rather than noise that could just as easily reverse itself the following week. By the time the purchase data clears that bar, the test has usually been live long enough that the team has moved on to the next idea, or spent budget on a change nobody can confirm actually worked.
Part of the spread between stores comes down to price. Low-AOV, impulse-purchase stores post far higher conversion rates than considered-purchase brands at higher price points, and if you mix the two populations into one industry benchmark, the number fits neither. A skincare brand selling a low-cost cleanser and a furniture brand selling a high-ticket sofa are running fundamentally different buying processes, and comparing either one to a blended average tells the operator nothing about their own funnel. Purchase conversion rate is not just slow to accumulate; it's also the wrong shape of number for most comparisons operators try to make with it.
None of this means purchase data is worthless. It is the only number that reflects actual revenue, and no other metric should replace it as the measure of whether a business is growing. But as a signal for deciding what to fix this week, it arrives too rarely and too late for most stores to use it that way. That gap in frequency is the reason operators need a different class of signal, one that fires constantly, tracks the same shoppers at every stage before they reach the purchase event, and gives a much faster read on where the funnel is actually breaking.
How blended conversion rate conceals where the funnel breaks
Even setting aside the low frequency of purchase events, a single blended conversion rate hides more than it reveals. Averaging all sessions into one number treats a first-time mobile visitor from a cold Meta ad the same as a returning desktop customer who already has an account and a saved cart, when those two shoppers are running through completely different decision processes with different sources of friction. Before any store compares itself to a benchmark or tracks its own number over time, it needs to split that number at least four ways: device, new versus returning visitor, paid versus organic source, and subscription versus one-time purchase. Each cut exposes a different funnel, and collapsing them back into one average erases the very information an operator needs to act.
The same blending problem occurs in add-to-cart behavior. As average order value rises, add-to-cart rate drops sharply, so the funnel for higher-consideration products leaks earlier than it does for cheaper, lower-commitment items. A lower-priced product and one priced many times higher do not lose shoppers at the same stage, and a store selling both under one roof will see an add-to-cart number that reflects neither category accurately. Treating that number as a single target to optimize misses the fact that two different shopper populations are failing at two different points in the journey.
The practical consequence is that "optimize the site" is the wrong goal to set against a blended number. The right goal is to find which segment, at which stage of the funnel, is losing shoppers, by looking inside the funnel itself. A segment-level audit might show new paid-mobile traffic drops out much earlier than returning desktop visitors. If so, you need to solve two different problems for two different audiences, not apply one general fix to the whole site. Diagnosing that split demands signals that fire at each stage of the journey, not just the one signal that fires at the end of it. That is what micro-conversions are built to provide.
Micro-conversion events worth tracking
Each stage of the funnel has its own event that fires more often than a purchase, sits closer to the moment a change in the product actually takes effect, and isolates a specific piece of shopper behavior the end-of-funnel number can't separate out on its own.
Checkout initiation shows you whether a shopper trusts the brand enough to start entering payment information. Most shoppers who add an item to their cart never complete the purchase, and mobile abandonment runs notably higher than desktop. Because checkout initiation and cart-to-checkout rate are two separate measurements, they expose two separate failure points: one inside the product experience that got the shopper to add the item in the first place, and one inside the checkout flow itself that stops them from finishing.
Cart-to-checkout rate isolates the specific friction between reviewing a cart and entering payment details. A drop at this stage usually points to shipping costs that surprise the shopper, missing trust signals like reviews or security badges, or a checkout interface that's confusing or slow, not to any flaw in the product itself.
Checkout completion rate covers the final step before an order is placed. When this rate is low but checkout initiation was healthy, the problem is payment friction, a form that asks for too much, or a cost that appears unexpectedly at the last screen, not anywhere earlier in the journey.
AI chat or on-site conversational engagement records the moment a shopper asks a question. This is the richest signal available for understanding intent, because the content of the question names the exact objection, point of confusion, or comparison the shopper is working through. Every question logged is a direct data point about what the product page failed to answer on its own.
Quiz or product-finder completion measures guided discovery. A shopper who finishes a recommendation quiz has self-selected into a high-intent group and handed over explicit preference data in the process. The completion rate, along with where shoppers drop off within the quiz, shows you exactly which decision variable you need to resolve before that shopper is ready to buy.
Return visit with product page engagement tracks a shopper who didn't convert the first time but came back and looked again. For higher-AOV categories that involve more than one session before purchase, this is often the strongest early indicator that a shopper is moving toward a decision, well before that decision turns into an add-to-cart event.
Sequencing micro-conversions into a funnel diagnostic rather than a list of metrics
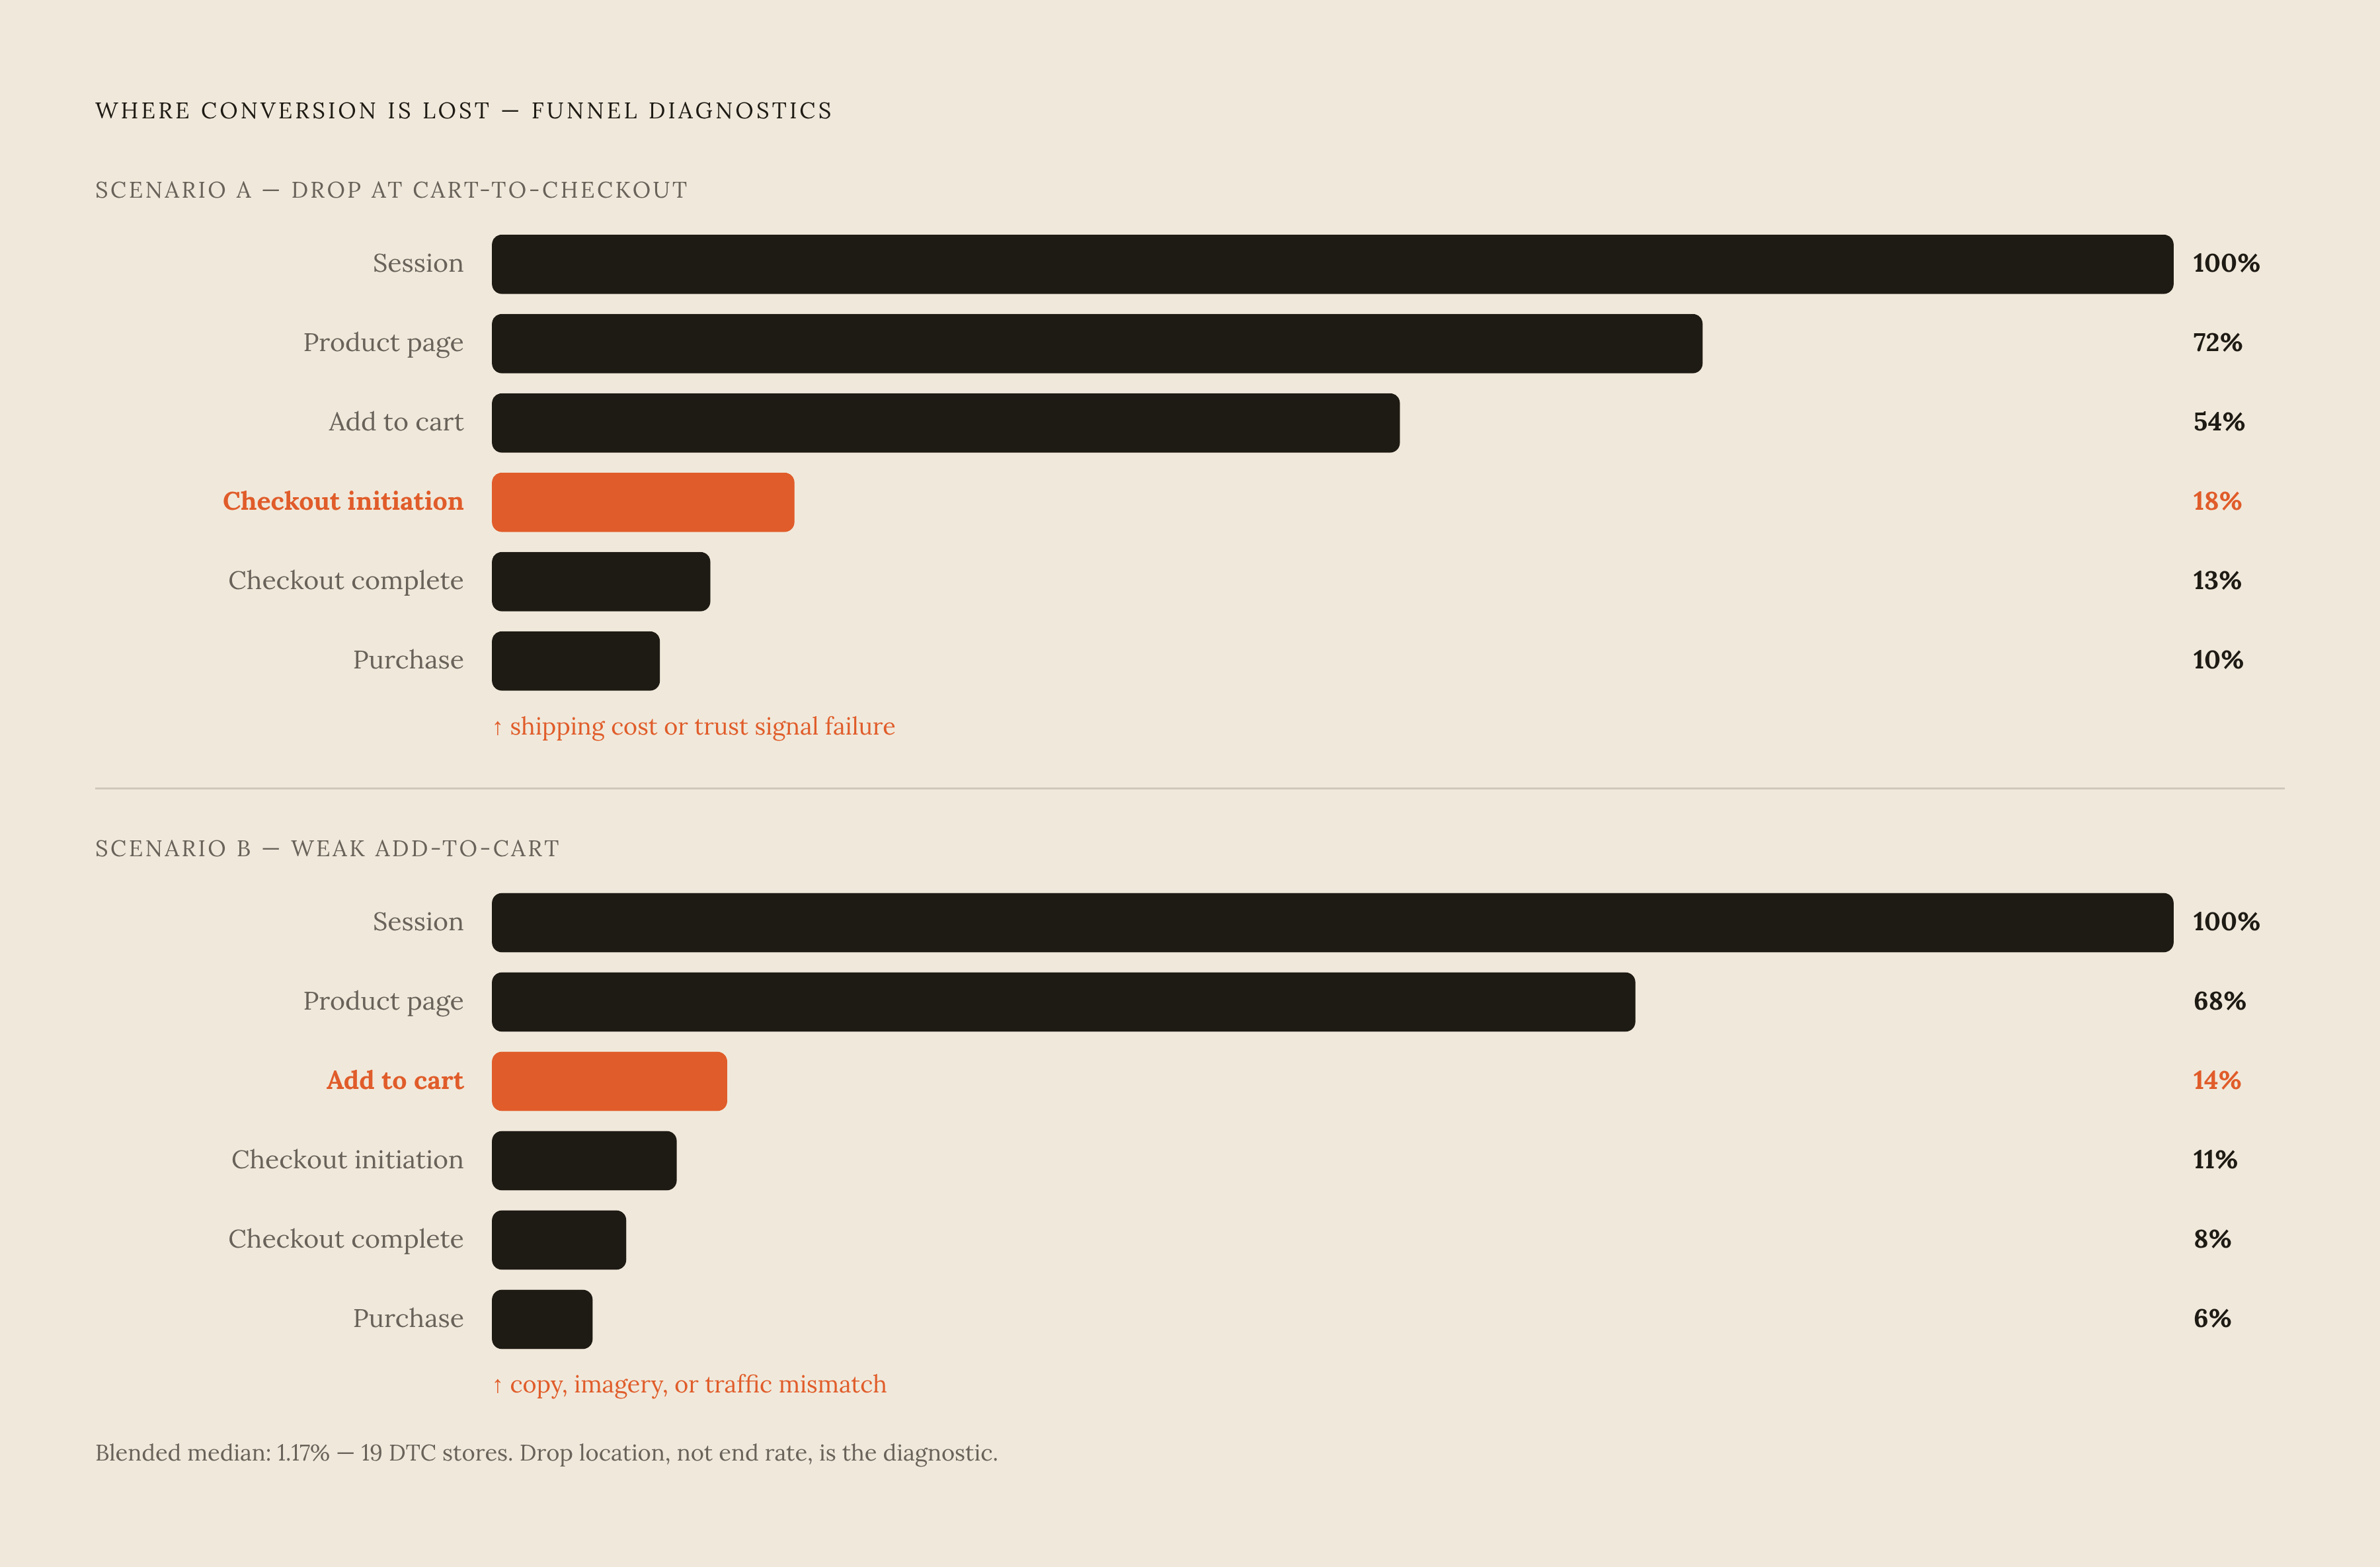
None of these events means much read in isolation. Their value comes from the ratio between adjacent stages, because a funnel that converts well from sessions to add-to-cart but badly from add-to-cart to checkout is describing a completely different problem than a funnel that loses shoppers before they ever add an item. The chain runs: session, product page engagement, add-to-cart, checkout initiation, checkout completion, purchase. Multiply every stage's rate together to get the blended conversion rate discussed earlier; the stage-level rates are what show you where along that chain the loss actually concentrates.
Consider a hypothetical that stays within the ranges already established: a store sees a strong session-to-add-to-cart rate, well above what its AOV bracket would predict, but a cart-to-checkout rate that falls off sharply. That pattern tells the operator the product pages are doing their job. Shoppers are convinced enough to add the item to their cart, so the problem sits downstream, most likely in shipping costs revealed at checkout, missing trust signals, or a clunky checkout interface. The fix sits entirely downstream of the product page. Now flip the pattern: a weak add-to-cart rate paired with normal rates at every stage after it. That combination points upstream, to product page copy, pricing presentation, imagery, or a traffic source bringing in visitors who were never a good match for the product.
Segmenting that same chain by audience sharpens the diagnosis further. New paid-mobile traffic commonly drops out far earlier in the funnel than returning desktop visitors, and sequencing micro-conversions by segment shows which audience and which stage need attention at the same time, rather than treating the funnel as one undifferentiated flow. Chat engagement adds a layer the numbers alone can't provide: when a large share of product-page visitors open a chat session before adding anything to their cart, that tells the operator the page isn't answering a specific question, and the content of those conversations names which question it is. For high-AOV stores where even add-to-cart events are too sparse to read reliably, return-visit sequences, the same visitor coming back for a second or third look with renewed product page engagement, extend the observable funnel further upstream, into the research phase that happens before any cart action.
This is a diagnostic built for operators who don't have enough purchase volume to localize a problem any other way, and the sequencing logic is what lets a handful of stage-level rates substitute for the purchase data that won't arrive in time to be useful.
One more segment deserves its own line in this chain: traffic arriving through AI-driven research channels. Shoppers who come from that kind of search have typically already narrowed their options inside a conversation before they land on the site, so their on-site conversion behavior tends to run ahead of cold paid traffic. So track AI-referred visitors as their own cohort with their own benchmarks, because their funnel behavior doesn't resemble Meta or Google traffic closely enough for you to judge it against the same numbers. Separately, stores whose catalogs are queried directly by AI shopping agents should know those agents skip products when size, color, material, current pricing, or category structure aren't represented as clean, separately addressable data.
Using micro-conversion signals to make confident decisions when purchase data is statistically insufficient
You track these events to act before purchase data reaches statistical significance, while revenue measurement remains the separate check on whether that action worked. That distinction matters because micro-conversions carry an obvious failure mode of their own: a brand can raise its add-to-cart rate, its chat engagement, and its quiz completion rate while moving no additional profit. Engagement that doesn't translate into revenue is a vanity metric wearing a funnel-stage label. If you treat it as proof of success, you make exactly the mistake micro-conversion tracking is supposed to prevent.
The fix is to hold two signals at once. Micro-conversions tell an operator where to act. Blended Marketing Efficiency Ratio, total revenue divided by total marketing spend, tells the operator whether that action is actually working, and because it looks at the whole business rather than one funnel stage, it can't be gamed by improving a single metric in isolation. The decision protocol follows from pairing the two: when a micro-conversion rate moves consistently in one direction across multiple sessions, treat that as a signal strong enough to justify shipping the next iteration of the test. If MER holds steady or improves over that same window, the direction is confirmed. If MER falls while the micro-conversion keeps climbing, the optimization has disconnected from revenue, and it needs to be questioned before it goes any further.
Sequencing the decision is straightforward. Rank the funnel stages by the size of the gap against whatever benchmark the store is using, start testing at the stage with the largest gap, track the micro-conversion tied to that stage, and if it moves while MER holds, ship the change and move down the list to the next stage. That cycle runs faster than waiting for purchase data to reach significance, and it's more honest than relying on platform-reported return on ad spend, which tends to take credit for revenue it didn't actually influence. Reading the content of chat conversations tightens that cycle even further, because the objection behind a drop-off sits directly in the transcript, so every chat log becomes a piece of qualitative research running alongside the quantitative funnel analysis.
One operational detail deserves direct attention: GA4's data-driven attribution model needs a minimum volume of conversions inside its 28-day lookback window to function, and when a store falls below that threshold, the model reverts to last-click attribution without any alert to the operator. A store running on degraded attribution and not aware of it will misread which channels are actually driving results. Below that threshold, micro-conversions are the only statistically reliable signal the store has.
The action to take this week is specific: set up a Shopify Analytics or GA4 segment for AI-referred traffic as its own cohort, separate from Meta and Google, and build a basic session-to-add-to-cart-to-checkout chain for that segment alongside the store's existing paid and organic splits. That single addition turns one more blind spot into a measurable stage, and gives the funnel one more point at which the next drop-off can be found and named.